Down markets kept target-date fund growth in check, but the push toward passive – and lower-cost – options picked up pace in 2018, according to a new report.
According to “The State of the Target-Date Market: 2019, Examining Asset Trends Across Providers, Products, Vehicles, Management Styles, and Glide Path Structures,” from Sway Research, mutual fund and CIT-based target-date solutions reached $1.77 trillion at year-end, up 1.1% from $1.75 trillion at the end of 2017. That said, the increase came from CIT-based solutions, which began 2018 with $638 billion in assets and ended the year at $677 billion for a gain of 6.1%. Mutual fund-based solutions actually slipped 1.9%, dropping from $1.11 trillion to $1.09 trillion amid a shift of funds from mutual funds to lower-cost CITs.
In fact, the report found that assets in target-date series that invest in passively managed underlying funds reached 53.3% of mutual fund and CIT target-date assets in 2018, up from 51.2% at year-end 2017 and 47.0% at year-end 2015.
Hybrid series, which invest in both active and passive underlying investments, reached 8.6% of the target-date market at year-end 2018, up from 7.2% a year prior and 7.0% at year-end 2015 – a move that Sway attributes largely to the result of recent shifts from active to hybrid by a number of target-date series as they seek to lower expenses through greater allocations to passive investments. Not surprisingly, target-date solutions invested in actively managed funds slipped to a 38% market share from 41.7% in 2017 and 46%.1% at the end of 2015.
The ‘800-Pound Gorilla’
Also not surprising in view of those trends is that the largest manager of target-date assets remains Vanguard, which managed $649 billion at the end of 2018, up 4.1% from a year earlier. More significantly, what Sway refers to as “the 800-pound target-date gorilla” managed a whopping 69% of the assets in passively managed target-date solutions at the end of 2018, while controlling 36.4% of the assets in mutual fund-based TDFs and 37.3% of the assets in CIT-based TDFs (36.7% overall).
At year-end 2018, the top three providers controlled 63% of target-date AUM, and the top five controlled 78%. Only 7.7% of non-custom target-date assets were controlled by a firm not among the top 10 providers. The top-three share of AUM has remained unchanged since 2015 at 63%, but Sway notes that the top five controlled 76% of target-date assets at the end of 2015; 10.5% of target-date assets were controlled by providers outside of the top 10 that year. In other words, the report notes, “the rich keep getting richer in the target-date space, while smaller managers are effectively being shut out.”
Recordkeeping ‘Rules’
The research notes that roughly half (49%) of target-date series are offered by firms with both asset management and DC recordkeeping businesses, yet these firms control 85% of non-custom target-date assets. In contrast, so-called “pure” asset managers offer nearly a third of the series (29%) but control just 14% of the assets.
The rest of the top 10 were:
2. Fidelity - 13.9% market share, $245 billion
3. T. Rowe Price - 12.6% market share, $223 billion
4. BlackRock - 8.5% market share, $151 billion
5. American Funds – 5.9% market share, $104 billion
6. J.P. Morgan – 4.8% market share, $85 billion
7. Principal – 3.2% market share, $56 billion
8. SSgA – 2.9% market share, $51 billion
9. Nuveen – 2.6% market share - $45 billion
10. American Century – 1.2% market share, $21 billion
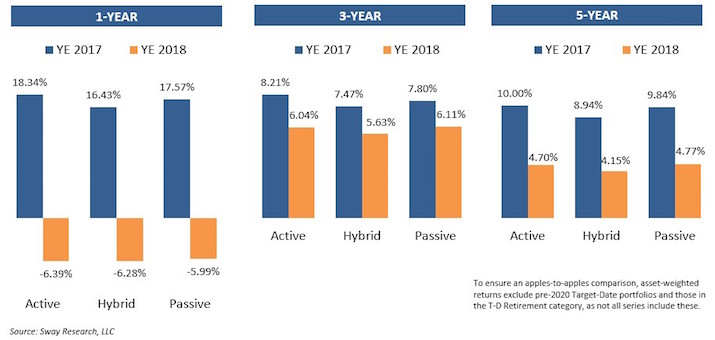
Last year’s negative stock market returns didn’t do anything to improve active performance, either. The report notes that active TDFs ended 2018 with lower asset-weighted returns than passive TDFs for one, three and five years – a reversal from the end of 2017, when actively managed target-date series finished with higher returns for the same periods.
Sway’s annual study of the target-date market is based on a proprietary database of mutual fund and CIT target-date portfolio and asset data, which includes 150 different target-date series spread across nearly 6,000 individual mutual fund share classes and CITs.
