 Based on the latest Consumer Price Index data, next year’s cost-of-living adjustment could be even higher than what was predicted just a month ago.
The Consumer Price Index for all items increased 5% for the 12-month period ending May, the Bureau of Labor Statistics announced June 10. This marks the largest 12-month increase since a 5.4% increase for the 12-month period ending in August 2008. The BLS further reports that the all-items index has been trending up every month since January, when the 12-month change was -1.4%.
According to BLS, the CPI All Urban Consumers (CPI-U) increased 0.6% in May on a seasonally adjusted basis after rising 0.8% in April. Additionally, the index for all items less food and energy rose 0.7% in May after increasing 0.9% in April.
The CPI for Urban Wage Earners and Clerical Workers (CPI-W), which is used to determine the Social Security COLA, increased 5.6% over the last 12 months. In May alone, the index rose 0.9% prior to seasonal adjustment.
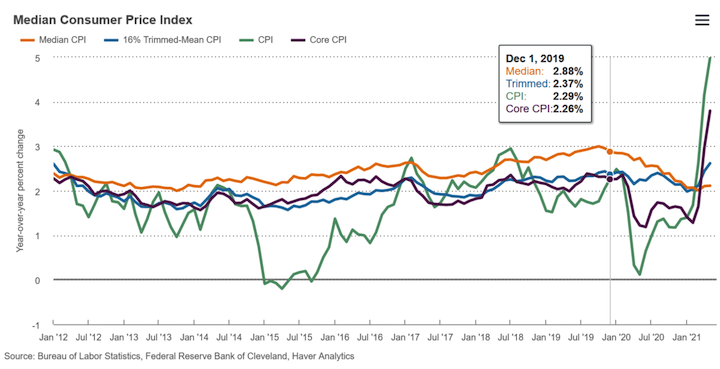
Here’s a look at the monthly median CPI going back to 2012:
Estimates released in early May by The Senior Citizens League (TSCL) predicted that Social Security recipients may get a 4.7% COLA in 2022—which would be the highest increase since 2009. In comparison, the Social Security COLA for monthly Social Security and Supplemental Security Income (SSI) benefits increased by 1.3% in 2021, 1.6% in 2020 and 2.8% in 2019. TSCL noted that with such a high level of inflation, the estimates could change several times before the 2022 COLA is announced in October 2021.
Each October, the SSA announces the annual COLA for the year, which provides an early precursor of what can be expected for COLAs on retirement plan contribution and benefit limits.
Under current law, the Social Security COLA is determined by the percentage of change in the Consumer Price Index for Urban Wage Earners and Clerical Workers (CPI-W), which is based on the expenditures of households included in the CPI-U definition that meet two requirements: more than half of the household’s income must come from clerical or wage occupations and at least one of the household’s earners must have been employed for at least 37 weeks during the previous 12 months. The CPI-W population represents about 29% of the total U.S. population.
TSCL has argued that one of the reasons Social Security COLAs have been so low in the past is because the CPI-W market basket belongs to younger working adults and does not include the households of people who are retired. As such, the CPI-W gives greater weight to consumer items purchased more frequently by younger people, while giving less importance to housing and medical expenses.
